Today we’ll be looking at visualising data in R.
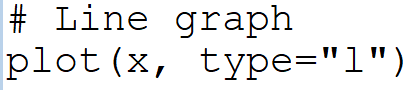
A line graph can be made as so:
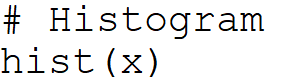
A histogram can be made like so:
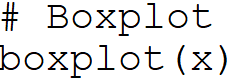
A boxplot can be made like so:
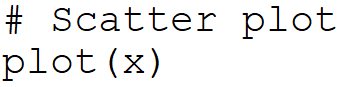
A scatter plot can be made like so:
There are so many different plotting libraries and functions, the only real way to get what you want is to review the documentation.
Next time
Next time we will be looking at maths in R, creating functions, solving differentials and performing decomposition of a matrix.
